GBP/USD
Analysis:
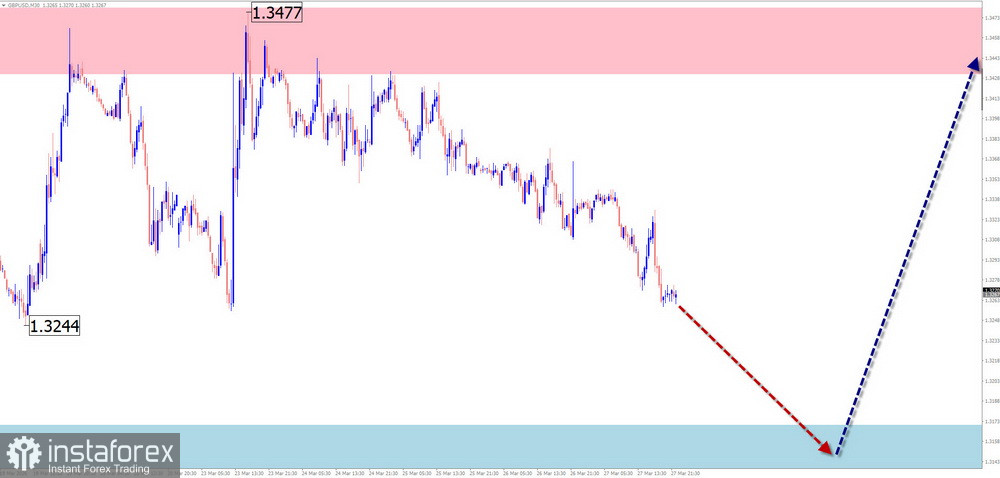
Analysis of the hourly chart of the British pound major pair shows that the downward wave that began on January 27 is not yet complete. The first segment (A) has been completed. Since early March, the middle part of the wave (B) has been forming in a sideways flat. The wave is developing as a shifting flat and remains unfinished. At the time of analysis, prices are moving within a defined price channel.
Forecast:
In the coming days, continued bearish movement of the pound is expected. In the second half of the week, a reversal near the support zone and renewed upward movement are likely. The upper boundary of the expected weekly range is defined by the calculated resistance.
Potential Reversal Zones
Resistance:
Support:
Recommendations:
Sell: Possible with small (fractional) volume sizes during individual sessions.Buy: Possible with reduced volume size only after confirmed reversal signals appear near support.
AUD/USD
Analysis:
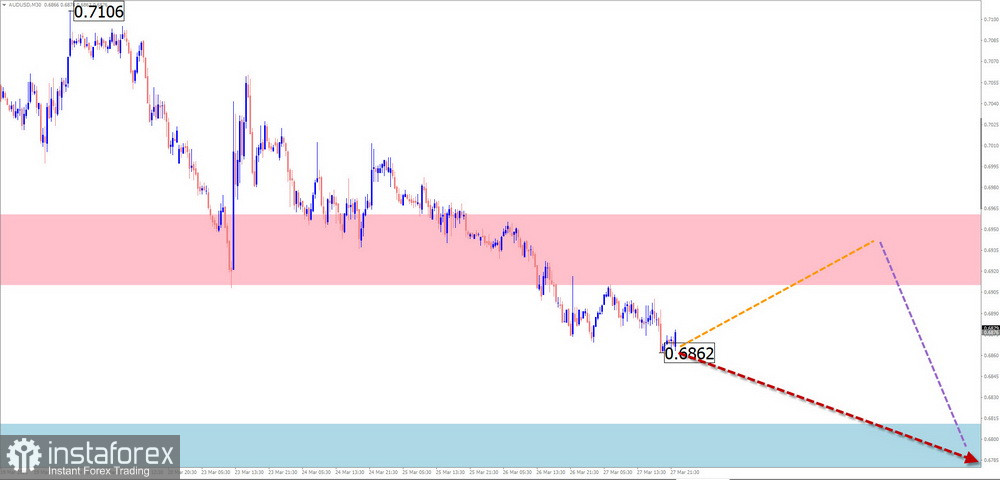
On the AUD/USD chart, a short-term downward wave has been developing since March 11. Within its structure, a counter-trend correction has been forming over the past week in the shape of a shifting flat. It remains incomplete at the time of analysis. Price is moving sideways between opposing zones.
Forecast:
During the upcoming week, sideways movement is expected to continue. In the first half, an upward bias is more likely. A reversal and renewed downward movement are expected closer to the weekend.
Potential Reversal Zones
Resistance:
Support:
Recommendations:
Sell: Possible with small volume sizes during individual sessions; potential limited by support.Buy: Premature until appropriate reversal signals appear near support.
USD/CHF
Analysis:
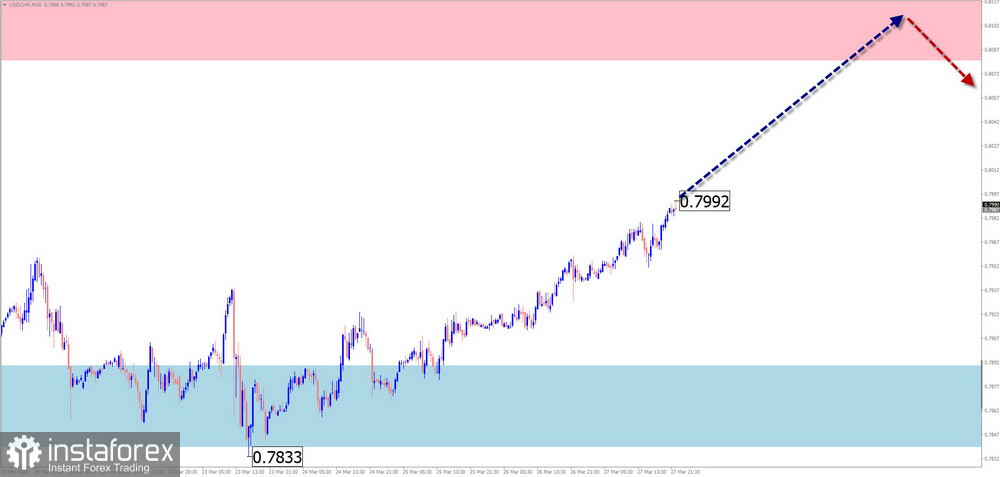
Since April last year, price movement in USD/CHF has been driven by a bullish wave. Within a larger structure, this wave represents a correction in the form of a shifting flat. The final segment of the wave is currently forming. Price is approaching the lower boundary of a broad daily reversal zone.
Forecast:
At the beginning of the week, continued upward movement is the most likely scenario, possibly reaching the resistance zone. After that, conditions for a reversal may form. A downward move is expected closer to the weekend.
Potential Reversal Zones
Resistance:
Support:
Recommendations:
Sell: Can be considered after reversal signals appear in the control zone.Buy: Possible intraday; safer to reduce position size.
EUR/JPY
Analysis:
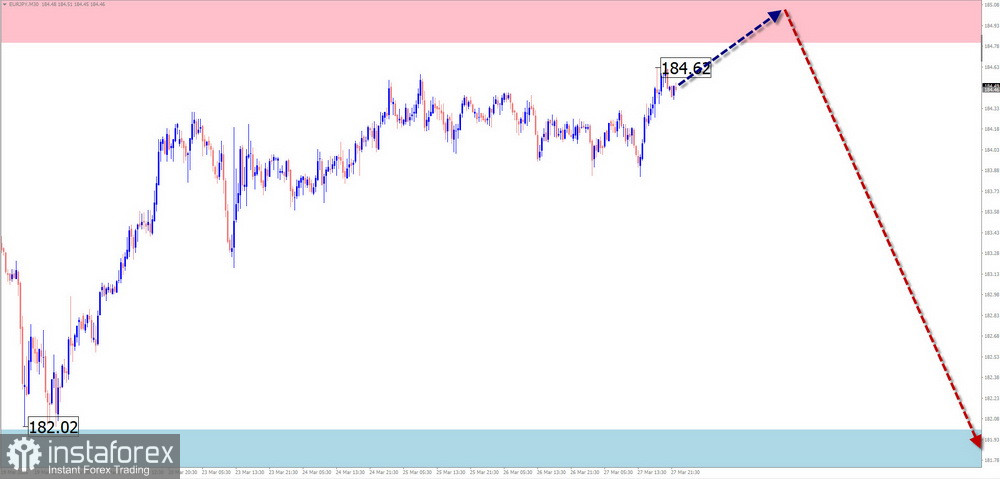
The global trend continues to push EUR/JPY upward. Price has reached the lower boundary of a strong weekly support zone. The latest trend segment began in late January. Throughout March, a correction has been forming, which is not yet complete.
Forecast:
During the upcoming week, price growth may complete and transition into sideways movement along resistance levels. By the end of the week, the likelihood of a reversal and downward movement increases. The downside potential is limited by calculated support.
Potential Reversal Zones
Resistance:
Support:
Recommendations:
Sell: Premature until the current wave completes and reversal signals appear.Buy: Risky, with limited potential.
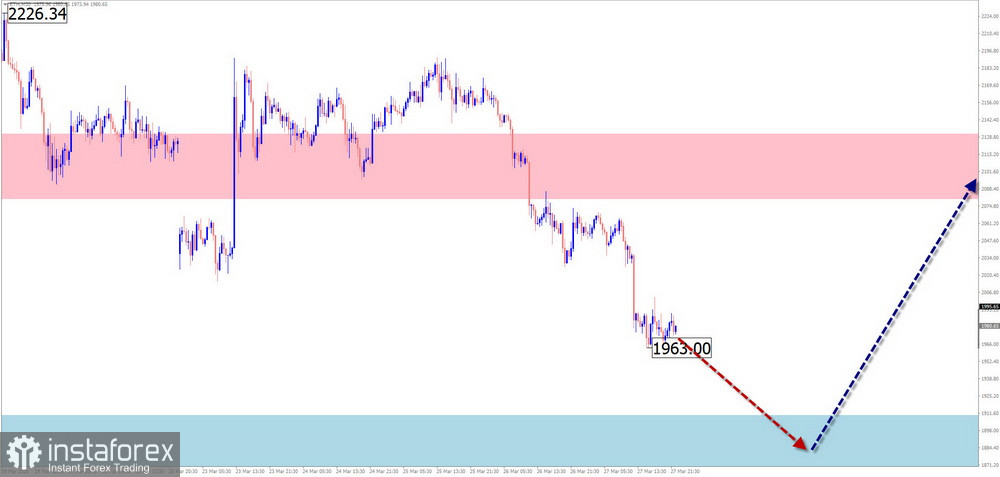
Ethereum
Analysis:
A bearish wave has been forming on the Ethereum chart since January. In February, price broke below a strong reversal zone and then began forming a correction (B) along this zone, mostly in a sideways pattern. This structure remains incomplete.
Forecast:
A continued sideways trend is expected during the week. A downward move in the first half of the week is likely to shift upward closer to the weekend. A breakout below support during this transition is unlikely.
Potential Reversal Zones
Resistance:
Support:
Recommendations:
Sell: Possible with small volume sizes during individual sessions.Buy: Premature until confirmed reversal signals appear near support.
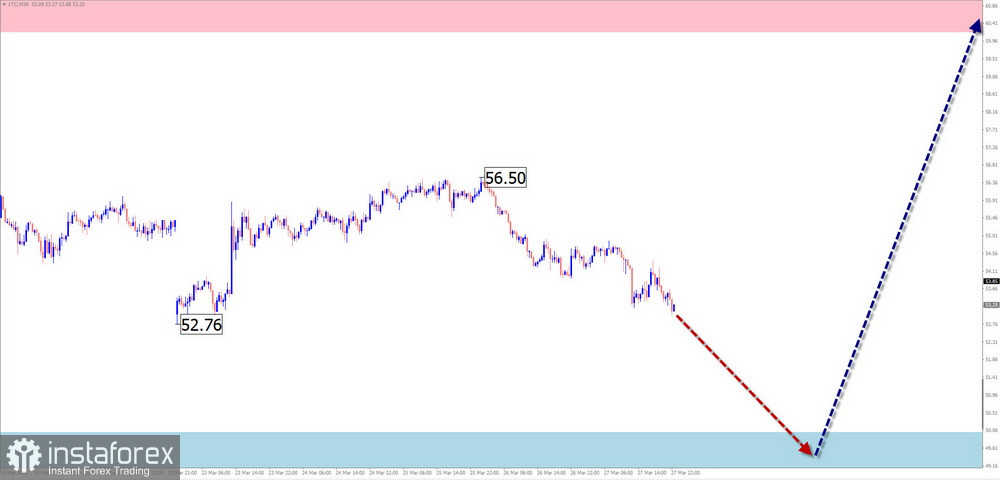
Litecoin
Analysis:
The current wave pattern on the Litecoin chart is a downward zigzag that began in October last year. Since early February, a corrective segment (B) has been forming in a sideways structure. Price is moving along the upper boundary of a strong daily reversal zone.
Forecast:
At the start of the week, a decline toward the support zone is most likely. In the second half of the week, the probability of upward movement increases. The resistance zone defines the upper boundary of the expected weekly range.
Potential Reversal Zones
Resistance:
Support:
Recommendations:
Buy: Possible after confirmed reversal signals appear near support.Sell: High risk, with potential limited by support.
Notes: In simplified wave analysis (SWA), all waves consist of three parts (A–B–C). On each timeframe, the latest unfinished wave is analyzed. Dashed lines indicate expected movements.
Attention: The wave algorithm does not take into account the duration of price movements over time.