Analyzing Tuesday's trades:
GBP/USD on 30M chart
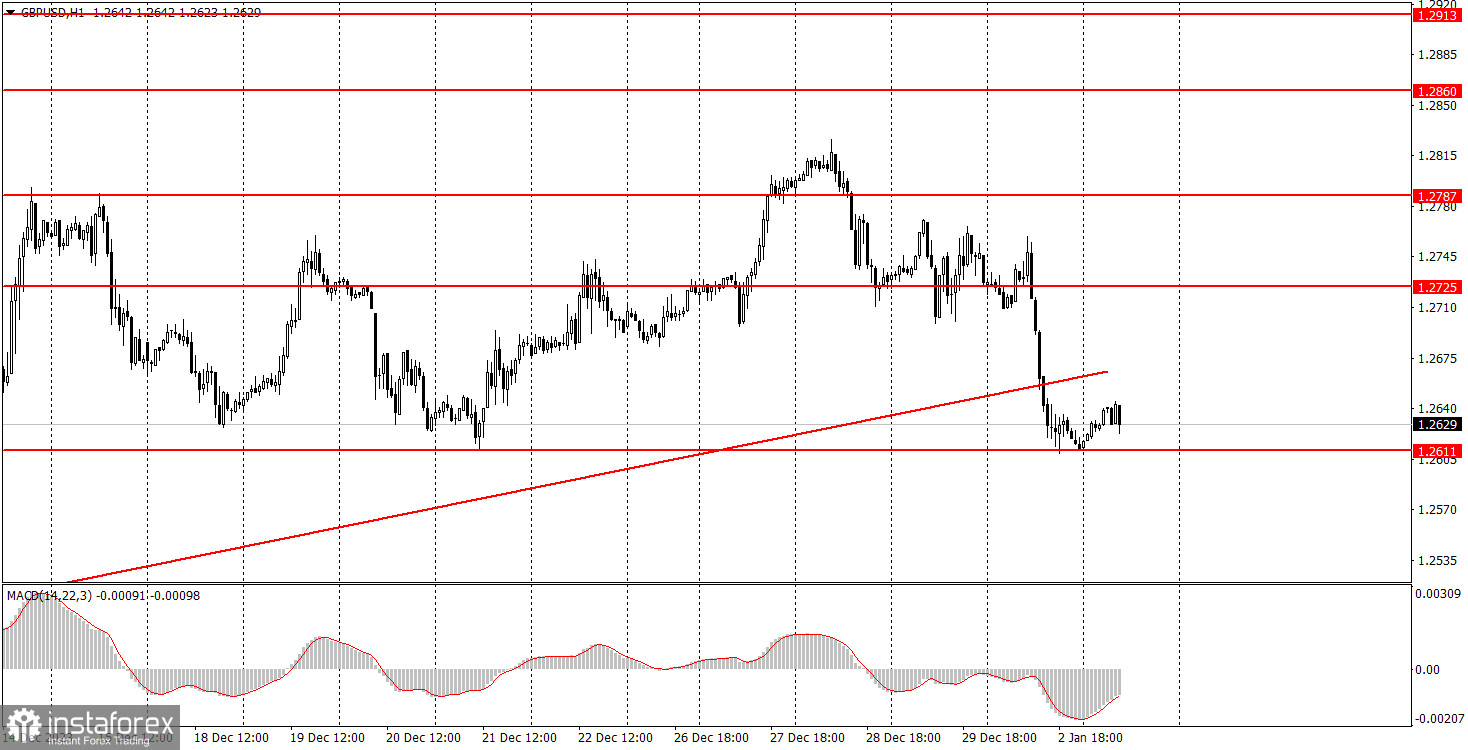
GBP/USD showed a significant decline at the end of the first trading day of the week. The pair notably broke through the ascending trendline, which had supported buyers for about two months or so. Now, this trendline is no longer relevant. However, we want to highlight the bounce from the level of 1.2611, which has repeatedly prevented the pair from falling. At the end of last year, the British pound also rebounded from this level, afterwards we witnessed a new phase of the uptrend.
Therefore, we advise you to be cautious with short positions until the pair overcomes this level. However, it is hard to deny the fact that the British pound is still quite overbought, and it doesn't have any reasons to rise further. The only report of the day, which was the Manufacturing PMI for December, expectedly remained below the 50 level, so there was no reason to buy the pound.
However, the US will release a lot of important macro data this week, which could potentially exert new pressure on the dollar. We believe that the US currency should strengthen, but if this week's data turns out to be weak again, it could negatively impact the pair's bearish prospects.
GBP/USD on 5M chart
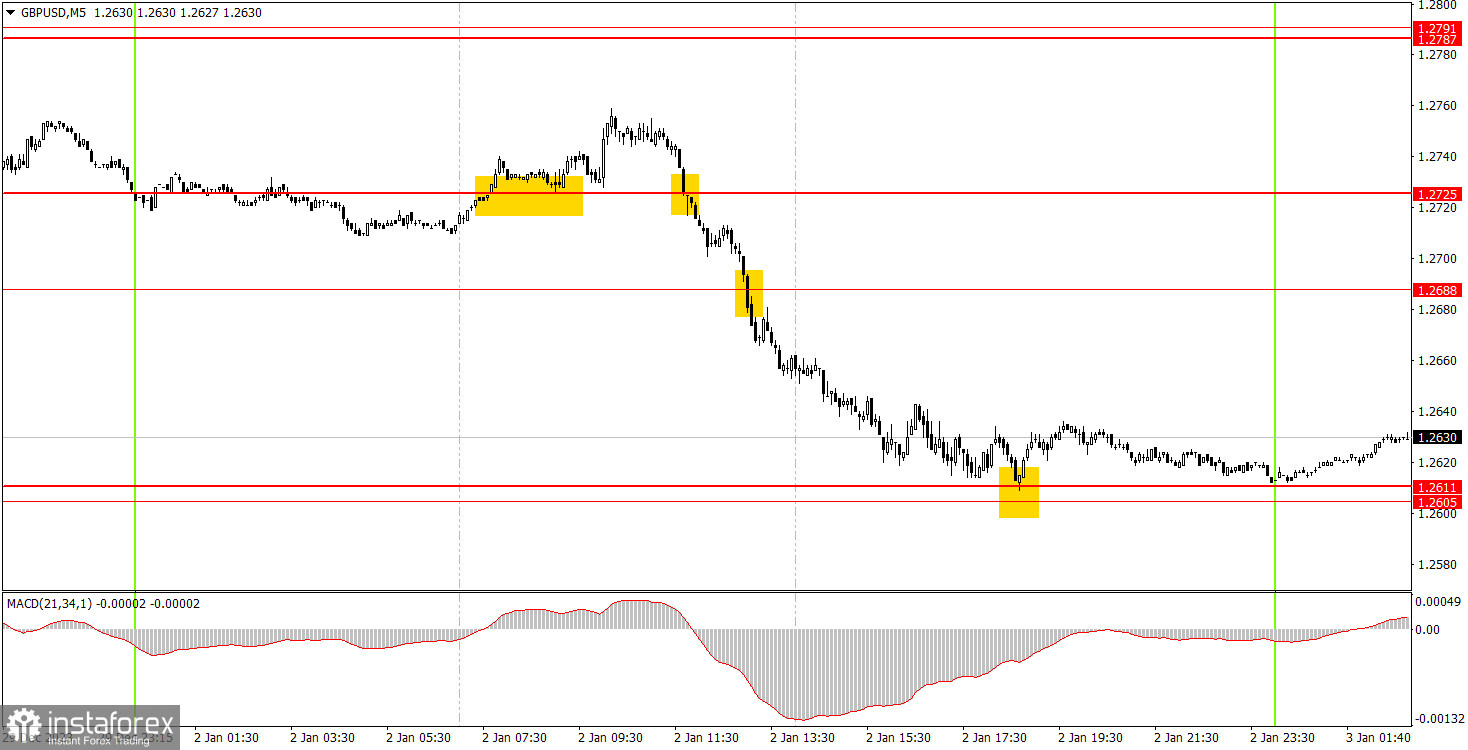
The trading signals were quite decent on the 5-minute chart. The first buy signal around the 1.2725 level turned out to be a false signal, but the price rose by 20 pips after its formation, so we placed a Stop Loss to break-even, which eventually worked. Traders could gain decent profit using the next sell signal around the same level, as the pair fell non-stop for the rest of the day. In the end, the price dropped to the 1.2611 level and bounced off it. At that point, we closed the short positions, with a profit of around 90 pips.
Trading tips on Wednesday:
On the hourly chart, GBP/USD broke the trendline and now, for the first time in a long while, has a real chance of forming a new downtrend. We have been waiting for the pound to start a steady downtrend for several weeks now, so we expect the price to overcome the 1.2611 level.
On Wednesday, the price could move away from the 1.2611 level before resuming its decline. It is quite possible that it will take a few days before the downward movement is restored. Much will depend on the US reports this week. If they turn out to be weak, this could stop the dollar from strengthening its positions.
The key levels on the 5M chart are 1.2270, 1.2310, 1.2372-1.2387, 1.2457, 1.2502, 1.2544, 1.2605-1.2611, 1.2688, 1.2725, 1.2787-1.2791, 1.2848-1.2860, 1.2913, 1.2981-1.2993. Today, the UK's event calendar is empty, while the US will release two important reports (ISM and JOLTs). In the evening, the Federal Reserve's minutes will be published, but we consider this event secondary of importance.
Basic trading rules:
1) Signal strength is determined by the time taken for its formation (either a bounce or level breach). A shorter formation time indicates a stronger signal.
2) If two or more trades around a certain level are initiated based on false signals, subsequent signals from that level should be disregarded.
3) In a flat market, any currency pair can produce multiple false signals or none at all. In any case, the flat trend is not the best condition for trading.
4) Trading activities are confined between the onset of the European session and mid-way through the U.S. session, after which all open trades should be manually closed.
5) On the 30-minute timeframe, trades based on MACD signals are only advisable amidst substantial volatility and an established trend, confirmed either by a trendline or trend channel.
6) If two levels lie closely together (ranging from 5 to 15 pips apart), they should be considered as a support or resistance zone.
How to read charts:
Support and Resistance price levels can serve as targets when buying or selling. You can place Take Profit levels near them.
Red lines represent channels or trend lines, depicting the current market trend and indicating the preferable trading direction.
The MACD(14,22,3) indicator, encompassing both the histogram and signal line, acts as an auxiliary tool and can also be used as a signal source.
Significant speeches and reports (always noted in the news calendar) can profoundly influence the price dynamics. Hence, trading during their release calls for heightened caution. It may be reasonable to exit the market to prevent abrupt price reversals against the prevailing trend.
Beginners should always remember that not every trade will yield profit. Establishing a clear strategy coupled with sound money management is the cornerstone of sustained trading success.